Evoked resonant neural activity long-term dynamics can be reproduced by a computational model with vesicle depletion.
Deep brain stimulation generates signals known as evoked resonant neural activity (ERNA). These signals can be used to fine tune where stimulation should be provided to treat Parkinson’s. However, the mechanisms of how they are generated by stimulation are not fully understood. To look for the origins of ERNA, we propose a mathematical model informed by data. The model's ability to replicate the slow dynamics of ERNA observed in people with Parkinson's shows its potential for guiding future research.
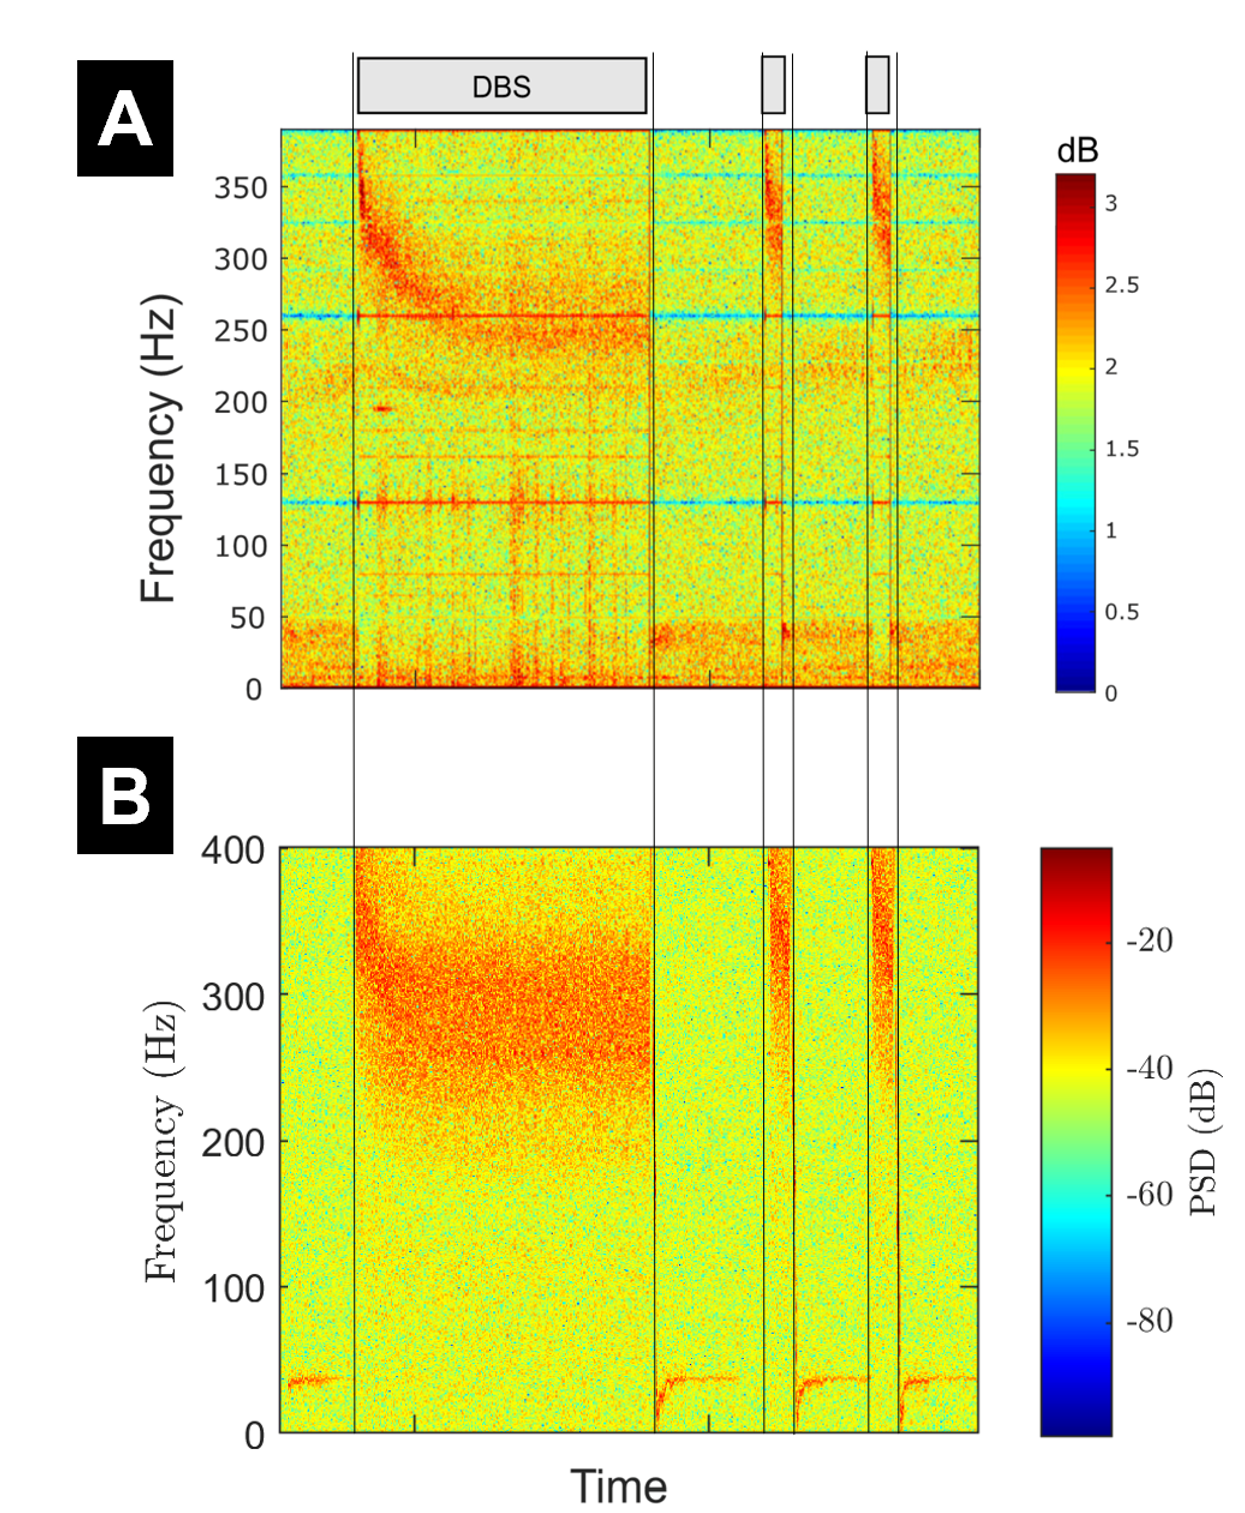
Subthalamic deep brain stimulation (DBS) robustly generates high-frequency oscillations known as evoked resonant neural activity (ERNA). Recently the importance of ERNA has been demonstrated through its ability to predict the optimal DBS contact in the subthalamic nucleus in patients with Parkinson's disease. However, the underlying mechanisms of ERNA are not well understood, and previous modelling efforts have not managed to reproduce the wealth of published data describing the dynamics of ERNA. Here, we aim to present a minimal model capable of reproducing the characteristics of the slow ERNA dynamics published to date. We make biophysically-motivated modifications to the Kuramoto model and fit its parameters to the slow dynamics of ERNA obtained from data. Our results demonstrate that it is possible to reproduce the slow dynamics of ERNA (over hundreds of seconds) with a single neuronal population, and, crucially, with vesicle depletion as one of the key mechanisms behind the ERNA frequency decay in our model. We further validate the proposed model against experimental data from Parkinson's disease patients, where it captures the variations in ERNA frequency and amplitude in response to variable stimulation frequency, amplitude, and to stimulation pulse bursting. We provide a series of predictions from the model that could be the subject of future studies for further validation.

2024. Neurobiol Dis, 199:106565.
2023. Neurobiol Dis, 178:106019.
2023. Mov Disord, 38(3):423-434.
2022. iScience, 25(4):104028.
2022. Brain, 145(1):237-250.